GUI Overview
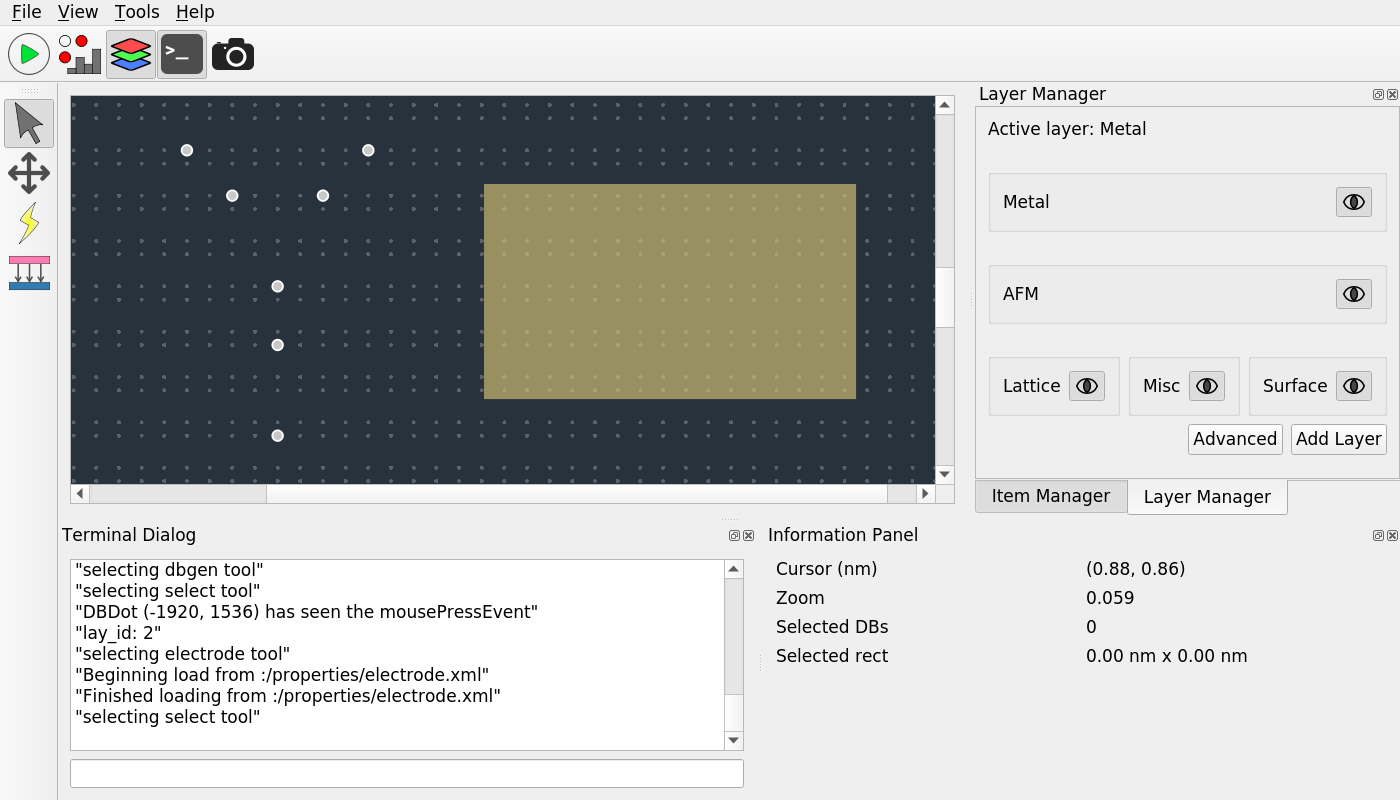
The SiQAD GUI consists of a few key components:
Design panel in the center showing DBs in white, lattice sites in gray, and an electrode in gold.
Top menu bar containing standard application toggles and features.
Top toolbar providing access to key manager widgets, panels, and modes:
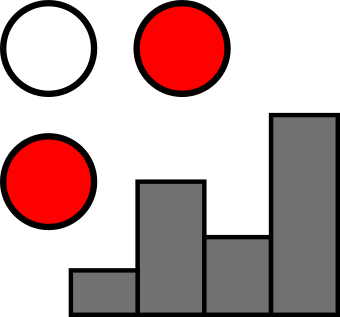
Run Simulation
 : Open the job management dialog for creating new simulation jobs and inspecting previous ones.
Sim Visualize
 : Toggle the simulation visualization panel for accessing simulation results.
Layer Manager
 : Toggle the layer manager panel which enables layer manipulation. Currently most useful for adding more Electrode layers for multi-layer electrode simulations.
Terminal Dialog
 : Toggle the terminal dialog which provides real time debug output and accepts SQCommands (to be documented).
Side toolbar detailed in later section: Design Mode.
Side and bottom docking areas for various manager widgets and panels.
Design Panel Modes and Features
Design Mode
The following design features can be found in the left toolbar:
Select Tool
 : select graphical objects in the design panel.
Drag Tool
 : drag on the design panel to pan the view point.
DB Gen Tool
 : create DBs on the design panel. Hover over the desired lattice site
Electrode Draw tool
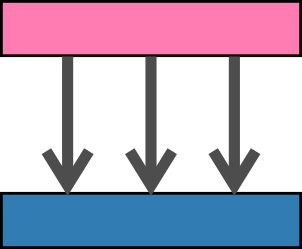 : create electrodes on the design panel.
Right clicking on the design panel reveals common actions such as delete, copy, paste, and more; right clicking on electrodes further reveal options to alter their electrical properties, color, and rotation.
Screenshot Mode
Screenshot Mode  can be activated in the top toolbar or in the “Tools” menu. It changes the design panel to a high contrast screenshot theme. A pop-up window shows available options for the screenshot, where the user can define screenshot properties such as the clipping area and scale bar settings. The screenshot output is a vector graphics SVG image.
When Screenshot Mode is active, DB Gen Tool and Electrode Draw tool cease to work.
The following additional design tools can be found in the side toolbar when screenshot mode is activated:
Screenshot Area Tool
 : select a region in the design panel to define the screenshot area. If no area is set, the full displayed region of the design panel is captured.
Scale Bar Tool
 : choose a position on the design panel to place the scale bar anchor. The “Show Scale Bar” option in the screenshot manager must also be enabled for the scale bar to be displayed.
Simulation Visualization Mode
Simulation Visualization Mode is activated automatically when simulation is complete.
When Simulation Visualization Mode is active, DB Gen Tool and Electrode Draw tool cease to work.
Screenshot Mode can be activated concurrently with Simulation Visualization Mode to take screenshots of simulation results.
For guidance on selecting and interpreting simulation results, please refer to the Simulation Visualization section.
Simulation Job
In SiQAD, simulators are implemented as plugins. Any interaction with plugins is treated as a Job. Simulations can be invoked through the Job Manager, which is accessed through the Run Simulation button in the top toolbar.
Below is a screenshot of the Job Manager interface:
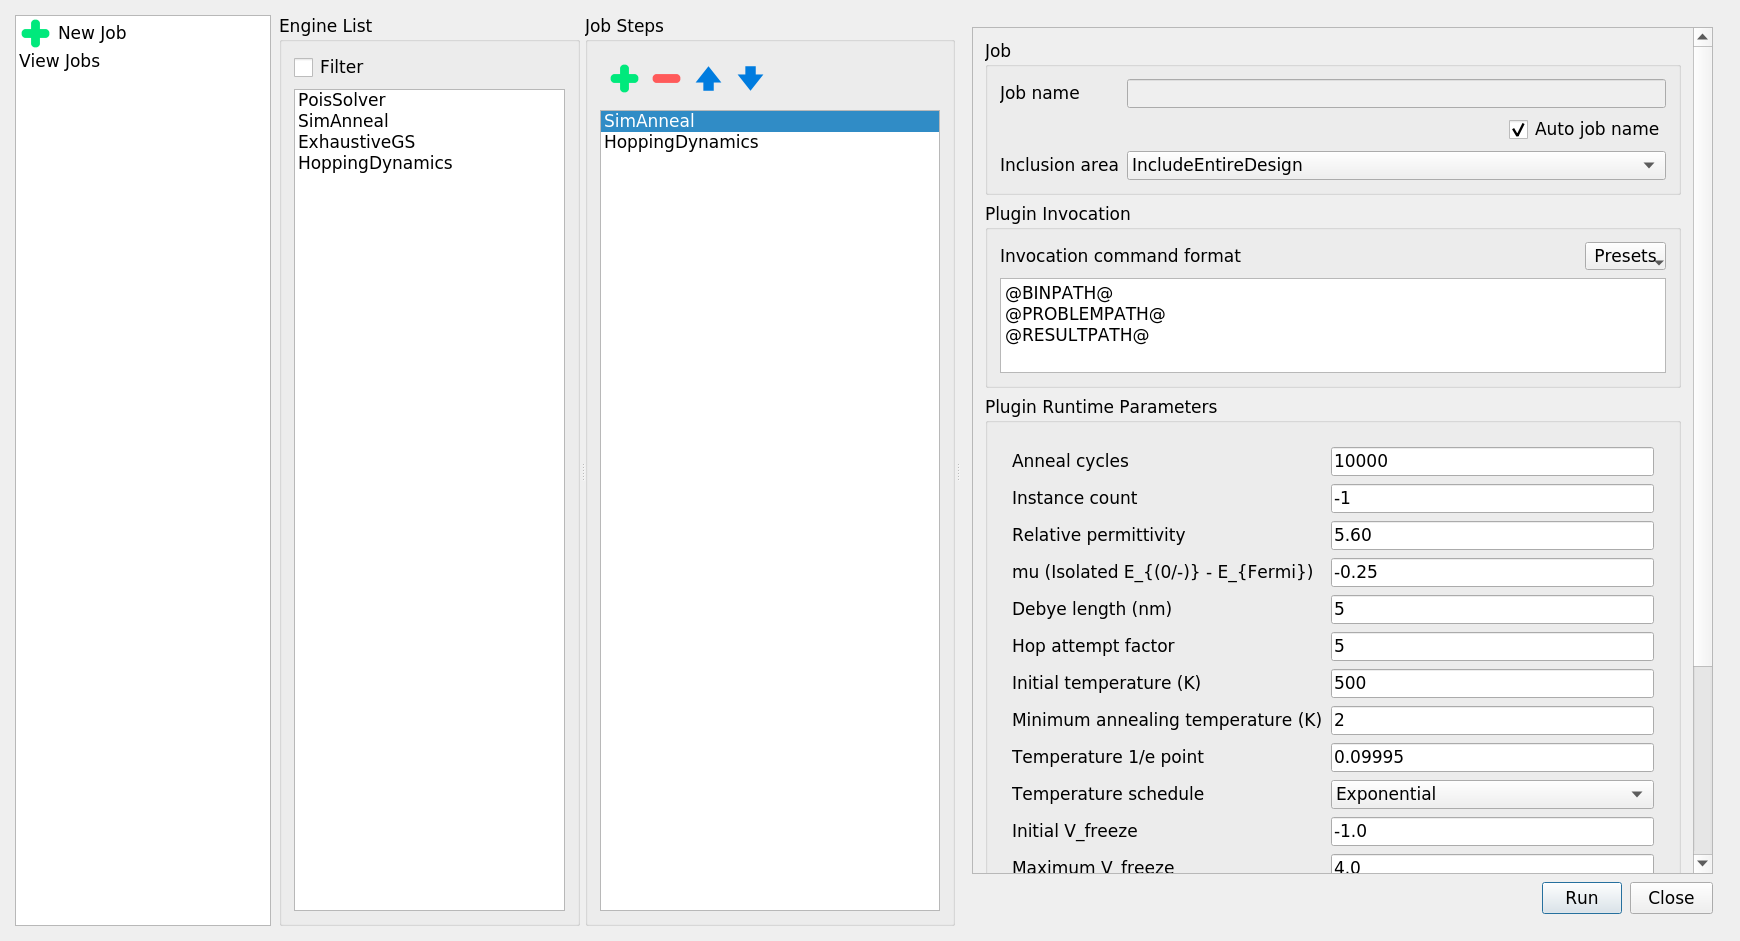
Four panes are shown:
Job Manager Actions: set up a new job or view previous jobs.
Engine List: Available simulation plugins, double click to add to Job Step List.
Job Step List:
Chosen plugins that execute in sequence in the order shown.
The order of job steps can be manipulated via the buttons at the top of the pane; job steps can also be removed.
Job and Plugin Details:
The job name can be configured or be left to auto generation. Auto job names use the invocation time.
Inclusion area allows users to choose whether to include the entire design in the simulation or include only selected items.
Plugin Invocation settings allow the plugin invocation command to be altered. Each parameter must be written in a separate line. Presets are available for some engines. The following special variables are replaced at invocation:
@PYTHON@: Python path identified by SiQAD, can be manually configured in Tools -> Settings.@BINPATH@: Absolute path to the plugin binary (or script file), defined in the*.sqplugor*.physengfile in the plugin’s directory.@PHYSENGPATH@: Absolute path to the directory containing the*.sqplugor*.physengfile.@PROBLEMPATH@: Absolute path to the problem description file that will be exported by SiQAD for the plugin to consume.@RESULTPATH@: Absolute path to the result file which SiQAD expects the plugin to generate.@JOBTMP@: Absolute path to the temporary path allocated for the job.@STEPTMP@: Absolute path to the temporary path allocated for the specific job step, normally a subdirectory of@JOBTMP@.
Plugin Runtime Parameters allow parameters pertaining to the plugin to be altered.